Chicago’s commercial real estate market is among the perennial contenders for “best CRE markets” nationwide along with New York City, Los Angeles, and San Francisco. While there are emerging markets experiencing growth in investments across the country and competing with the more traditional markets, Chicago is still a strong investment option for CRE investors and people looking to diversify their investment portfolios.
Furthermore, despite the pandemic, Chicago’s major commercial real estate sectors are holding strong, and even growing, especially the industrial sector.
The Current Chicago Commercial Real Estate Market
To highlight some of the major economic statistics in the area, we compiled the key points of Chicago’s commercial real estate market with stats that focus on 4 primary sectors: office, industrial, multifamily, and retail. This report includes: cap rates, vacancy rates, sales volumes, and population growth.

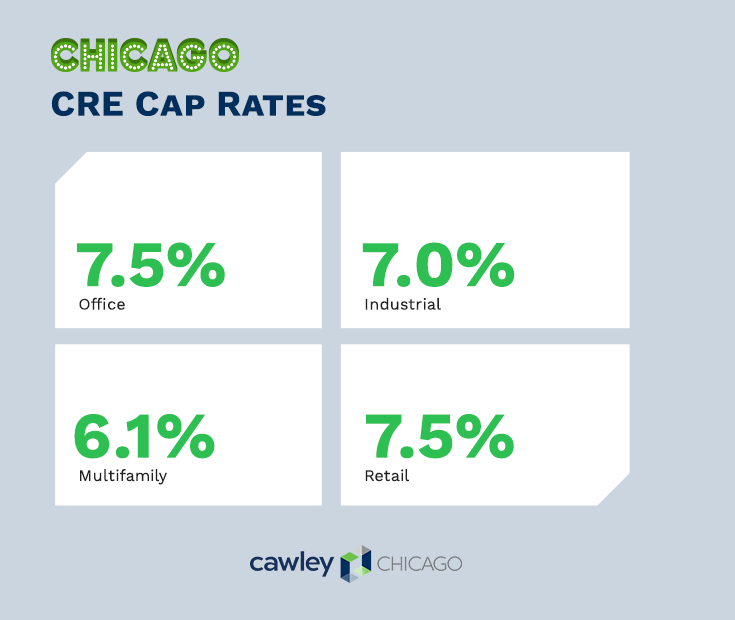
1) Chicago Cap Rates
Chicago’s cap rates between commercial real estate sectors are all positive and relatively similar (around 7%), save the multifamily sector, with a cap rate of 6.1%.
- Office: 7.5%
- Industrial: 7.0%
- Multifamily: 6.1%
- Retail: 7.5%

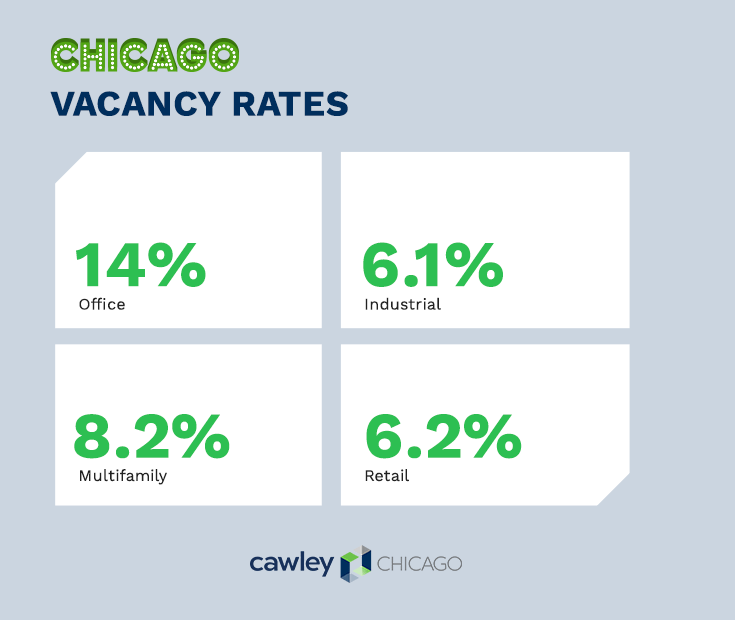
2) Chicago Commercial Real Estate Vacancy Rates
Chicago’s vacancy rates across all sectors are also fairly similar this year, between 6% and 8%; however, the office market has taken a hit with vacancy rates rising to 14%. This is no surprise, as the pandemic forced labor markets to change and many businesses either closed or shifted to allow employees to work at home.
- Office: 14%
- Industrial: 6.1%
- Multifamily: 8.2%
- Retail: 6.2%
3) Chicago Asking Rates
- Office: $29.16 / SF
- Industrial: $7.57 / SF / NNN
- Multifamily: $1,423/ unit
- Retail: $18.85 / SF
4) Chicago Absorption Rates (12 Month Net)
- Office: -5,400,000 SF
- Industrial: 18,600,000 SF
- Multifamily: 196 Units
- Retail: 823,000 SF
5) Chicago Commercial Real Estate Sales (Past 12 Months)
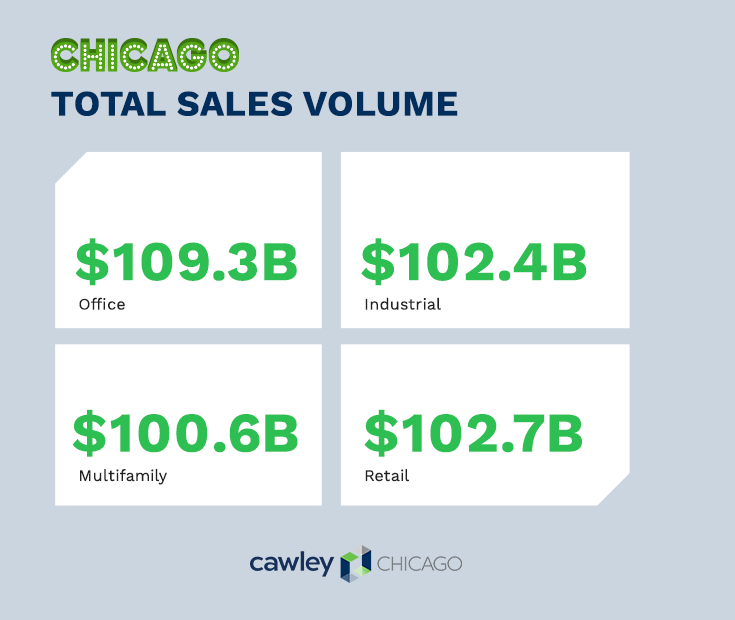
Chicago’s commercial real estate market sales statistics in 2020 across the four primary sectors.
Chicago Commercial Real Estate Total Sales Volume
- Chicago Office: $109.3B
- Chicago Industrial: $102.4B
- Chicago Multifamily: $100.6B
- Chicago Retail: $102.7B
Chicago Office Sales
Sales Comparables: 727
Average Cap Rate: 8.7%
Price / SF: $186
Average Vacancy During Sale: 11.0%
Chicago Industrial Sales
Sales Comparables: 1,085
Average Cap Rate: 8.6%
Price / SF: $75
Average Vacancy During Sale: 8.5%
Chicago Multifamily Sales
Sales Comparables: 606
Average Price / Unit: $130,000
Average Price / Multifamily Property: $3,500,000
Average Vacancy During Sale: 8.2%
Chicago Retail Sales
Sales Comparables: 1,614
Average Cap Rate: 7.7%
Price / SF: $161
Average Vacancy During Sale: 7.4%
6) Chicago Commercial Real Estate Properties Under Construction
Chicago’s commercial real estate market is currently experiencing an even balance of new construction projects across all sectors. Each sector is adding around or over 1% of inventory to their respective markets, as indicated by the stats shown below. Chicago’s retail market is adding less than a half of a percent of inventory with 0.2% of inventory being added currently by new construction projects in the area.
Chicago Office Properties Under Construction
# of Properties: 26
Total Square Feet: 4 ,801,907
% of Inventory: 1.0%
Preleased: 42.1%
Chicago Industrial Properties Under Construction
# of Properties: 58
Total Square Feet: 21,748,957
% of Inventory: 1.8%
Preleased: 61.6%
Chicago Multifamily Properties Under Construction
# of Properties: 61
Total Units: 9,350
% of Inventory: 1.8%
Average # of Units: 153
Chicago Retail Properties Under Construction
# of Properties: 53
Total Square Feet: 951,297
% of Inventory: 0.2%
Preleased: 76.6%
7) Chicago Labor Force Statistics
The Chicago-Joliet-Naperville MSA had an unemployment rate of 7.2% as of November 2020, which dropped significantly from 12.7% unemployment in August 2020. While these numbers are traditionally higher than most, it is important to take into account the context of the pandemic and its effects on labor markets nationally and globally.
To put things into perspective, Chicago’s MSA has an unemployment rate that is not as high as Las Vegas, which has the highest unemployment rate in the country currently at 10.4% or Detroit at 10.1%. Meanwhile it is a bit higher than Phoenix, San Francisco, or Seattle’s unemployment rate which all sit around 7 – 8% unemployment currently.
Chicago’s Median Household Income
Chicago’s median household income is currently $61,811 per year, according to Statista.com. This ranks 14th among the Top-25 Most Populated MSAs in the United States. This median household income is also in the top 30% of cities nationwide, regardless of population size.
8) Chicago Population Growth
According to Macrotrends.net, the population of Chicago’s MSA in 2020 was 8,865,000, which represents a 0.03% increase from 2019. The city of Chicago has 2.7 million residents and is currently the 3rd largest city in the country by population. While the population is not experiencing the growth of the late-1900s and early 2000s, it is growing and maintaining a stable population across all age group demographics.
Figures and stats collected from CoStar and the commercial real estate experts at Cawley Commercial Real Estate.


