

Tenants in Chicago’s office market continue to scrutinize their space requirements, shifting per-worker demand and driving up the amount of available space. A near- historical high of 101 million SF of space 19.7% is available in Chicago, an increase of approximately 25 million SF versus 20Q1. In addition, the sublet availability rate is on the rise again, posting another record-high of 2.5%, or 12.9 million SF. It is also being observed that many employers are letting their lease obligations expire, with no thoughts about moving their stakes elsewhere.
According to Site Selection Magazine, Chicago took the number one prize for luring the most corporate relocations and expansions for the 10th year in a row in 2023, with 448 projects on the books. Yet, Chicago’s office occupancy does not reflect the expected impact. In fact, its vacancy rate now stands at 16.3%—a record high—and move-outs are still outpacing move-ins, with -6.1 million SF of negative absorption recorded over the past 12 months.
Although the office market is clearly in trouble with these foreboding markers, there is some light at the end of the tunnel, via space demolition and repurpose, though there may be some initial shocks to it from the transformation process. Like the 2.3 million SF absorption loss that was triggered when Transformco, the parent company of Sears, went under contract with Compass Datacenters to purchase the former sprawling Sears corporate campus in Hoffman Estates during 23Q2.
Even as demand is expected to drift lower over the coming quarters, Chicago should be at the tail end of its largest supply wave in over a decade, with only 2.1 million SF currently under construction. Most of this is medical lab space. Chicago is trying to become known for life sciences, competing with the more-expensive markets on the left and right coasts. Two major life science buildings are underway with 24Q2 deliveries—one near the University of Chicago (302,000 SF) and another near Northwestern University (207,000 SF). In addition, Sterling Bay delivered its 336,000-SF life science building to its Lincoln Yards site in 23Q2.
“As companies embrace the enduring shift towards a hybrid work model, there is a significant opportunity to transform traditional offices into appealing spaces that captivate employees.”
– Robynn Lynn, Licensed Business Manager
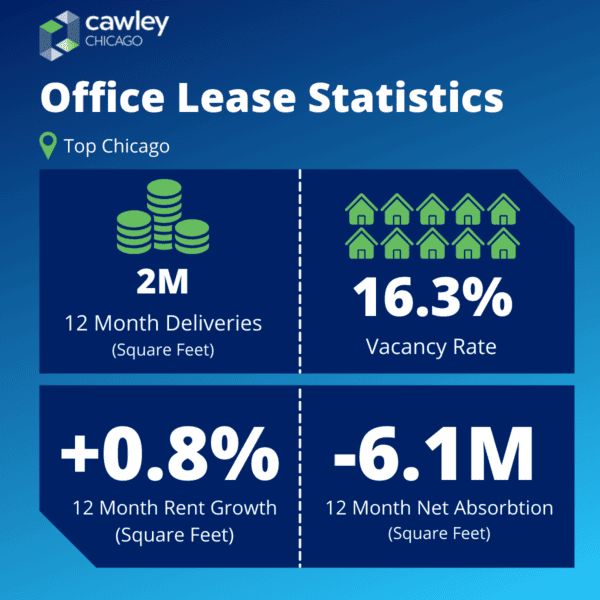
Top Overall Chicago Office Real Estate Lease Statistics (Past 12 Months)
12 Month Deliveries (Square Feet): 2 million (2.1 million in Q2 2023)
12 Month Net Absorption (Square Feet): -6.1 million (-3 million in Q2 2023)
Vacancy Rate: 16.3% (15.7% in Q2 2023)
12 Month Rent Growth: 0.8% (+1% in Q2 2023)
Top Chicago Office Leases (Past 12 Months)
1) Property: 1000 Deerfield Pky
Submarket: South Lake County
Leased SF: 211,660
Quarter: Q1 2023
Tenant: Siemens Building
Tenant Rep: N/A
Leasing Rep: N/A
2) Property: T5@Chicago
Submarket: O’Hare
Leased SF: 206,900
Quarter: Q1 2023
Tenant: CDW Corporation
Tenant Rep: N/A
Leasing Rep: N/A
3) Property: 525 W Monroe St
Submarket: West Loop
Leased SF: 204,000
Quarter: Q1 2023
Tenant: Katten
Tenant Rep: CBRE
Leasing Rep: Tishman Speyer
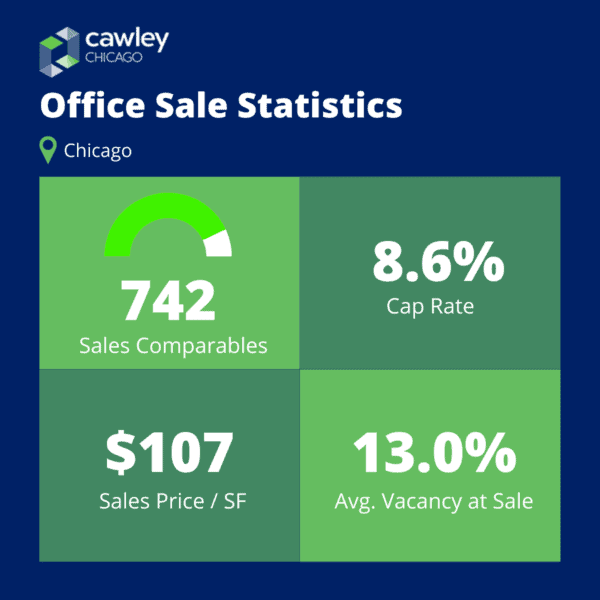
Top Chicago Office Sales Statistics (Past 12 Months)
Sales Comparables: 742 (861 in Q2 2023)
Average Cap Rate: 8.6% (8.6% in Q2 2023)
Average Price/ SF: $107 ($115 in Q2 2023)
Average Vacancy at Sale: 13.0% (10.8% in Q2 2023)
Top Chicago Office Real Estate Property Sales
1) Property: Burr Ridge Medical Center (6800 N Frontage Rd)
*Rating: 4
Year Built: 2010
Building SF: 104,912
Vacancy: 0%
Price (PSF): $59,950,000 ($571)
Cap Rate: Not Listed
2) Property: The Reserve at Deer Park
*Rating: 4
Year Built: 2002
Building SF: 341,092
Vacancy: 0%
Price (PSF): $59,000,000 ($173)
Cap Rate: 9.2%
3) Property: 230 W Monroe St
*Rating: 4
Year Built: 1971
Building SF: 707,000
Vacancy: 35%
Price (PSF): $45,000,000 ($64)
Cap Rate: Not Listed
*Rating is 1-5, 5 being the best

Chicago Office Construction Projects Statistics
Properties Currently Under Construction: 26 (25 in Q2 2023)
Total Size: 2M SF (1.7M SF in Q2 2023)
Percent of Inventory: 0.4% (0.3% in Q2 2023)
Preleased: 65.9% (63.4% in Q2 2023)
Top Chicago Office Projects Under Construction
1) Property: 360 North Green (360 N Green St)
Rating*: 5
Building SF: 493,680
Stories: 24
Completion: Q1 2024
Developer/ Owner: Sterling Bay
2) Property: 919 on Fulton
Rating*: 4
Building SF: 369,008
Stories: 11
Completion: Q4 2024
Developer/ Owner: JDL Development / Fulton St. Companies
3) Property: 311 W Huron St
Rating*: 4
Building SF: 217,000
Stories: 15
Completion: Q4 2023
Developer/ Owner: North Wells Capital / Urban Innovations
*Rating is 1-5, 5 being the best
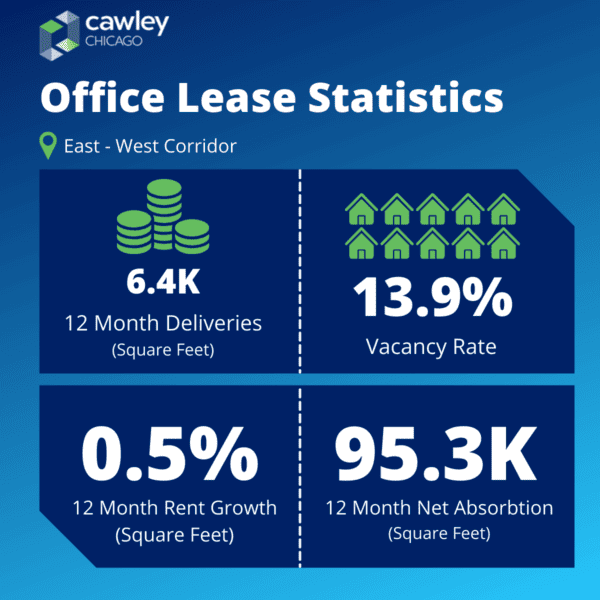
Top Eastern East-West Corridor Office Real Estate Lease Statistics (Past 12 Months)
12 Month Deliveries (Square Feet): 6.4K (2.5K in Q2 2023)
12 Month Net Absorption (Square Feet): 95.3K (-73.7K in Q2 2023)
Vacancy Rate: 13.9% (14% in Q2 2023)
12 Month Rent Growth: 0.5% (1.6% in Q2 2023)
4 & 5 Star Office Properties Leasing Activity in Eastern East-West Corridor (Past 12 Months)
1) Property: Hub 1415
Rating: 4
Deals: 4
Square Feet: 144,109
Vacancy: 44.6%
Net Absorption: 48,176
2) Property: Arboretum Lakes III (801 Warrenville Rd)
Rating: 4
Deals: 2
Square Feet: 2,824
Vacancy: 28.1%
Net Absorption: 27,712
3) Property: Naperville Corporate Center (1240 E Diehl Rd)
Rating: 4
Deals: 2
Square Feet: 26,043
Vacancy: 60.6%
Net Absorption: 26,315
*Rating is 1-5, 5 being the best
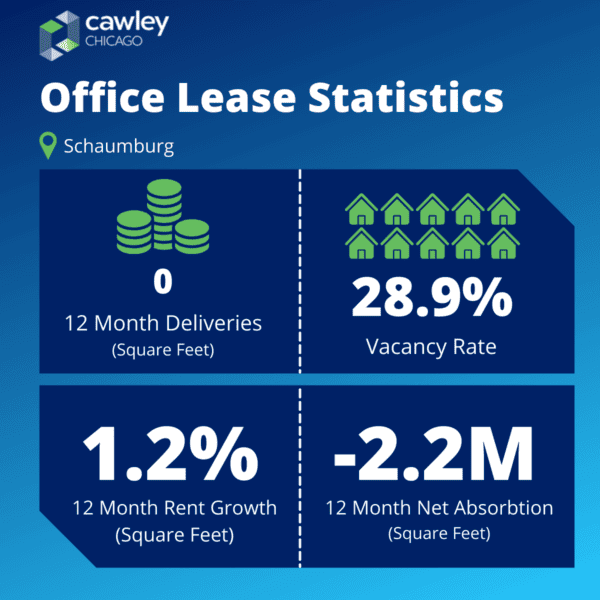
Top Schaumburg Office Real Estate Lease Statistics (Past 12 Months)
12 Month Deliveries (Square Feet): 0 (0 in Q2 2023)
12 Month Net Absorption (Square Feet): -2.2M (-2.2M in Q2 2023)
Vacancy Rate: 28.9% (29% in Q2 2023)
12 Month Rent Growth: 1.2% (0.8% in Q2 2023)
4 & 5 Star Office Properties Leasing Activity in Schaumburg (Past 12 Months)
1) Property: Schaumburg Corporate Center (1515 E Woodfield Rd)
Rating: 4
Deals: 6
Square Feet: 91,564
Vacancy: 42.5%
Net Absorption: 79,188
3) Property: 150 N Martingale Rd
Rating: 4
Deals: 3
Square Feet: 41,749
Vacancy: 60.5%
Net Absorption: 26,743
3) Property: Lakewoods Corporate Center I (650 E Algonquin Rd)
Rating: 4
Deals: 4
Square Feet: 12,430
Vacancy: 8.1%
Net Absorption: 15,542
Top Eastern East-West Corridor Office Sales Statistics (Past 12 Months)
Sales Comparables: 91 (112 in Q2 2023)
Average Cap Rate: 8.3% (9.3% in Q2 2023)
Average Price/ SF: $85 ($94 in Q2 2023)
Average Vacancy at Sale: 16.1% (13.8% in Q2 2023)
Top Eastern East-West Corridor Office Real Estate Property Sales
1) Property: Corporate Lakes I (2525 Cabot Dr)
*Rating: 3
Year Built: 1986
Building SF: 78,756
Vacancy: 34.5%
Price (PSF): $4,475,000 ($57)
Cap Rate: Not Listed
1) Property: Royal Glen Office Center (1200 Roosevelt Rd)
*Rating: 3
Year Built: 1970
Building SF: 52,400
Vacancy: 5.3%
Price (PSF): $4,175,000 ($80)
Cap Rate: Not Listed
Top Schaumburg Office Sales Statistics (Past 12 Months)
Sales Comparables: 42 (53 in Q2 2023)
Average Cap Rate: 7.6% (7.1% in Q2 2023)
Average Price/ SF: $75 ($73 in Q2 2023)
Average Vacancy at Sale: 30.3% (31.1% in Q2 2023)
Top Schaumburg Office Real Estate Property Sales
1) Property: Northwest Point (50 NW Point Blvd)
*Rating: 4
Year Built: 1999
Building SF: 177,095
Vacancy: 0%
Price (PSF): $29,125,000 ($164)
Cap Rate: Not Listed
2) Property: Northwest Crossings (1421 W Shure Dr)
*Rating: 4
Year Built: 1974
Building SF: 205,639
Vacancy: 0%
Price (PSF): $27,600,000 ($134)
Cap Rate: Not Listed
Eastern East-West Corridor Office Construction Projects Statistics
All-Time Annual Average Square Feet: 515,316 (516,264 in Q2 2023)
Delivered SF (Past 8 Qs): 51,969 (47,600 in Q2 2023)
Delivered SF (Next 8 Qs): 19,339 (19,339 in Q2 2023)
Proposed SF (Next 8 Qs): 986,325 (989,825 in Q2 2023)
Top Eastern East-West Corridor Office Project Deliveries
1) Property: 250 E Roosevelt Rd
Rating*: 2
Building SF: 3,500
Stories: 2
Completion: Q3 2023
Developer/ Owner: N/A
Top Eastern East-West Corridor Office Projects Under Construction
1) Property: Baird & Warner (1528 Aurora Ave)
Rating*: 3
Building SF: 15,000
Stories: 1
Completion: Q3 2023
Developer/ Owner: RXHST Manager, LLC
Top Eastern East-West Corridor Office Projects Proposed
1) Property: Central Park of Lisle
Rating*: 3
Building SF: 243,000
Stories: 6
Completion: Q2 2024
Developer/ Owner: Lincoln Property Company / N/A
Schaumburg Office Construction Projects Statistics
All-Time Annual Average Square Feet: 248,196 (248,592 SF in Q2 2023)
Delivered SF (Past 8 Qs): 0 (0 SF in Q2 2023)
Delivered SF (Next 8 Qs): 40,000 (0 SF in Q2 2023)
Proposed SF (Next 8 Qs): 101,821 (101,821 SF in Q2 2023)
Top Schaumburg Office Projects Proposed
1) Property: Schaumburg Medical Center (405 Arbor Glen Blvd)
Rating*: 4
Building SF: 45,000
Stories: 3
Completion: Q2 2024
Developer/ Owner: Not Listed / Marc Realty
Data Sources: Cawley Commercial Real Estate & CoStar
*Cited Sources: Globe St – Office Property Construction