
Cawley Commercial Real Estate’s industrial experts pull the top stats for leases, sales, and projects under construction in Chicago’s industrial real estate market every quarter in order to get a clear idea of where the market is and where it is going. Cawley also covers the I-88 West and South I-55 corridor industrial real estate markets comparatively.
The suburban Chicagoland industrial market has seen unprecedented velocity and rent growth over the last few years, which most outsiders are already aware of. Where activity has been particularly ferocious over the last 4-6months has been in the I-55 and I-80 submarkets. Throughout 2018, both of these pockets were considered to be overbuilt by many industry experts, with multiple 1m SF+ speculative developments sitting empty for a period of time.
Q3 produced four industrial lease transactions in excess of 3,400,000 SF in the I-55/I-80 submarket with tenants such as: Target, Amazon, RJW Logistics, and Crate & Barrel. Demand for big box facilities in these strategic locations is driven by proximity to major expressways, access to skilled and unskilled labor, as well as access to both the BNSF Logistics Park Chicago and Union Pacific Joliet Intermodal. Companies utilize the intermodals to keep shipping costs minimal.
Based on current supply and demand trends, steady rent growth in most of the Chicagoland market, and continued capital interest from the investment market, the outlook for 2020 Industrial Real Estate is all positive.
– Jack Brennan, Senior Associate / Industrial Specialist @ Cawley Commercial Real Estate
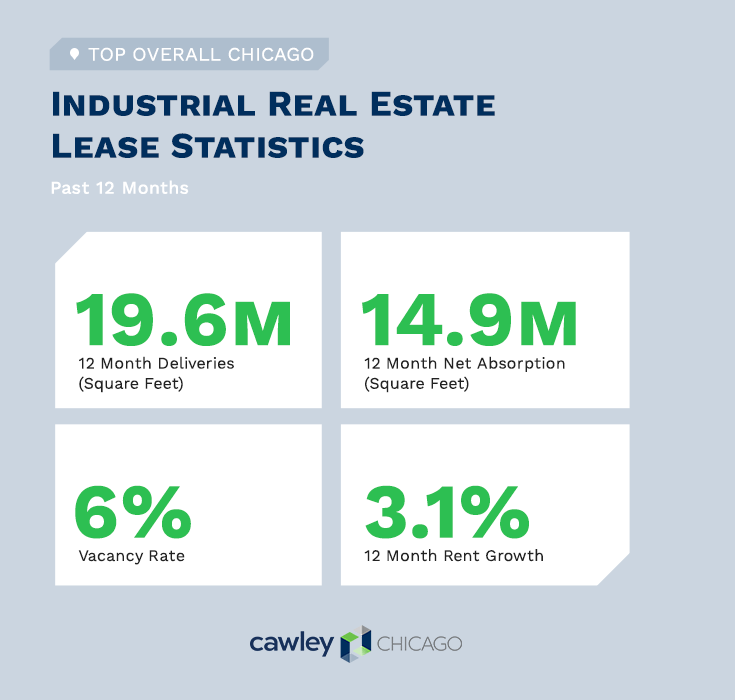
Top Overall Chicago Industrial Real Estate Lease Statistics
12 Month Deliveries (Square Feet): 19.6 million
12 Month Net Absorption (Square Feet): 14.9 million
Vacancy Rate: 6%
12 Month Rent Growth: 3.1%
Top Chicago Industrial Leases (Past 12 Months)
1) Property: 3300 Channahon Rd
Submarket: Joliet Area
Leased SF: 1,220,140
Quarter: Q3 2019
Leasing Rep: NAI Hiffman
2) Property: 120th Ave & 122nd St
Submarket: Kenosha East
Leased SF: 590,525
Quarter: Q1 2019
Tenant: Fresenius Kabi
Tenant Rep: CBRE
Leasing Rep: Cushman & Wakefield
3) Property: 2850 Duke Oky
Submarket: 1-88 West
Leased SF: 549,588
Quarter: Q2 2019
Tenant: Wholesale Interiors
Leasing Rep: Colliers International
4) Property: 20100 Renwick Rd
Submarket: South I-55 Corridor
Leased SF: 543,780
Quarter: Q4 2019
Tenant: RJW Logistics
Leasing Rep: Cushman & Wakefield
5) Property: 2602 128th Ave
Submarket: Kenosha East
Leased SF: 524,339
Quarter: Q2 2019
Tenant: Sligan Containers Corp
Leasing Rep: CBRE
Top Chicago Industrial Sales Statistics (Past 12 Months)
Sales Comparables: 1,317
Average Cap Rate: 8.5%
Average Price/ SF: $67
Average Vacancy at Sale: 14.4%
Top Chicago Industrial Property Sales
1) Property: Bldg 1 (1955 W North Ave)
*Rating: 3
Year Built: 1955
Building SF: 1,561,613
Vacancy: 0%
Price (PSF): $125,000,000 ($80)
Cap Rate: 6.3%
2) Property: FedEx Distribution Center (5959 W Howard St)
*Rating: 4
Year Built: 2015
Building SF: 314,202
Vacancy: 0%
Price (PSF): $84,262,035 ($268)
Cap Rate: 5.7%
3) Property: 930 W Evergreen Ave
*Rating: 4
Year Built: 1998
Building SF: 280,500
Vacancy: 67.9%
Price (PSF): $73,284,000 ($261)
Cap Rate: Not Listed
4) Property: 525 Northwest Ave
*Rating: 5
Year Built: 2015
Building SF: 588,536
Vacancy: 0%
Price (PSF): $70,600,000 ($120)
Cap Rate: 4.5%
15 Property: Building 1 (2357 S Wood St)
*Rating: 5
Year Built: 2017
Building SF: 227,043
Vacancy: 0%
Price (PSF): $68,683,000 ($303)
Cap Rate: Not Listed
*Rating is 1-5, 5 being the best
Chicago Industrial Construction Projects Statistics
Properties Currently Under Construction: 89
Total Size: 20,133,521 SF
Percent of Inventory: 1.7%
Preleased: 31.1%
Top Chicago Industrial Projects Under Construction
1) Property: Steiner Rd & 143rd St
Rating*: 3
Building SF: 1,500,000
Stories: 1
Completion: Q1 2020
Developer/ Owner: Seefried Properties Inc
2) Property: Northpoint’s Avenue O (11600 S Avenue O)
Rating*: 3
Building SF: 1,197,000
Stories: 1
Completion: Q1 2020
Developer/ Owner: NorthPoint Development
3) Property: Exchange 55 (3501 S Pulaski Rd)
Rating*: 5
Building SF: 999,900
Stories: 1
Completion: Q4 2020
Developer/ Owner: Shapack Partners / Walton Street Capital LLC
4) Property: Orchard Gateway (I-88 & Orchard Rd)
Rating*: 3
Building SF: 764,895
Stories: 1
Completion: Q3 2020
Developer/ Owner: Panattoni Development Company
5) Property: 9401 Grand Ave
Rating*: 4
Building SF: 756,714
Stories: Not Listed
Completion: Q4 2019
Developer/ Owner: Digital Realty Thrust
*Rating is 1-5, 5 being the best
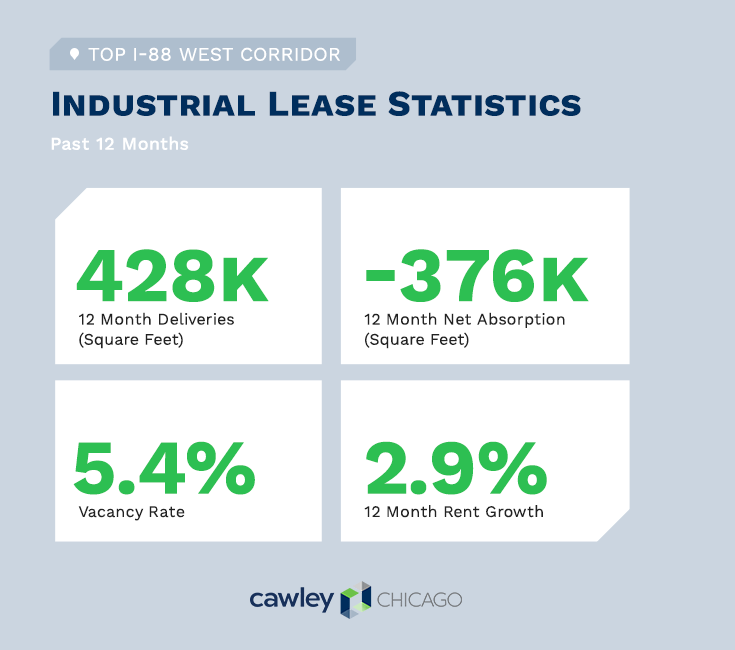
Top I-88 West Corridor Industrial Lease Statistics (Past 12 Months)
12 Month Deliveries (Square Feet): 428K
12 Month Net Absorption (Square Feet): -376K
Vacancy Rate: 5.4%
12 Month Rent Growth: 2.9%
4 & 5 Star Industrial Properties Leasing Activity in I-88 West Corridor (Past 12 Months)
1) Property: Jefferson Business Center (1748 W Jefferson Ave)
Rating: 4
Deals: 2
Square Feet: 68,932
Vacancy: 59.3%
Net Absorption: 40,110
2) Property: 1998 Melissa Ln
Rating: 4
Deals: 2
Square Feet: 103,949
Vacancy: 67.6%
Net Absorption: 0
3) Property: 2119 Fisher Drive
Rating: 4
Deals: 1
Square Feet: 104,957
Vacancy: 100%
Net Absorption: 0
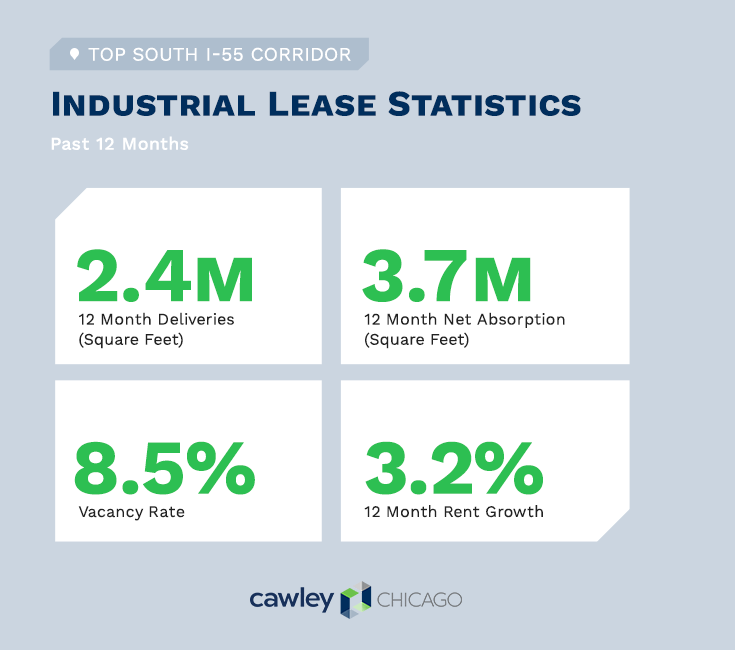
Top South I-55 Corridor Industrial Lease Statistics (Past 12 Months)
12 Month Deliveries (Square Feet): 2.4M
12 Month Net Absorption (Square Feet): 3.7M
Vacancy Rate: 8.5%
12 Month Rent Growth: 3.2%
4 & 5 Star Industrial Properties Leasing Activity in South I-55 Corridor (Past 12 Months)
1) Property: 850-880 Remington Blvd
Rating: 4
Deals: 1
Square Feet: 50,338
Vacancy: 0%
Net Absorption: 50,338
2) Property: 101 Paragon Dr
Rating: 4
Deals: 2
Square Feet: 44,865
Vacancy: 58.6%
Net Absorption: 44,865
3) Property: 1049 Lily Cache Ln
Rating: 4
Deals: 2
Square Feet: 62,873
Vacancy: 0%
Net Absorption: 0
Top I-88 West Industrial Sales Statistics (Past 12 Months)
Sales Comparables: 77
Average Cap Rate: 9.6%
Average Price/ SF: $71
Average Vacancy at Sale: 8.2%
Top I-88 West Industrial Real Estate Property Sales
1) Property: Space Center Aurora II (2580 Prospect Ct)
*Rating: 4
Year Built: 1998
Building SF: 650,000
Vacancy: 0%
Price (PSF): $39,596,000 ($61)
Cap Rate: Not Listed
2) Property: Butterfield I (2702 Eola Rd)
*Rating: 4
Year Built: 1997
Building SF: 252,946
Vacancy: 0%
Price (PSF): $20,625,000 ($82)
Cap Rate: Not Listed
3) Property: BYTEGRID’s Chicago (4267 Meridian Pkwy)
*Rating: 2
Year Built: 2007
Building SF: 70,000
Vacancy: 0%
Price (PSF): $20,500,000 ($293)
Cap Rate: Not Listed
Top South I-55 Industrial Sales Statistics (Past 12 Months)
Sales Comparables: 54
Average Cap Rate: 7.4%
Average Price/ SF: $92
Average Vacancy at Sale: 19.7%
Top South I-55 Industrial Real Estate Property Sales
1) Property: Building III (700 Weber Rd)
*Rating: 5
Year Built: 2015
Building SF: 602,820
Vacancy: 0%
Price (PSF): $60,560,366 ($100)
Cap Rate: Not Listed
2) Property: Inventory Facility II (1150 W 115th St)
*Rating: 5
Year Built: 2008
Building SF: 453,090
Vacancy: 59.5%
Price (PSF): $45,518,225 ($100)
Cap Rate: Not Listed
3) Property: Building III (700 Weber Rd)
*Rating: 5
Year Built: 2015
Building SF: 602,820
Vacancy: 0%
Price (PSF): $28,937,904 ($96)
Cap Rate: Not Listed
I-88 West Industrial Construction Projects Statistics
All-Time Annual Average Square Feet: 157,276
Delivered SF (Past 4 Qs): 303,694
Delivered SF (Next 4 Qs): 2,337,908
Proposed SF (Next 4 Qs): 1,196,038
Top I-88 West Industrial Projects Delivered
1) Property: 540 Frontenac Rd
Rating*: 4
Building SF: 131,040
Stories: 1
Completion: Q2 2019
Developer/ Owner: Peak Construction Corp / City of Naperville
2) Property: 1998 Melissa Ln
Rating*: 4
Building SF: 172,654
Stories: 1
Completion: Q1 2019
Developer/ Owner: The Missner Group Co / First Industrial Realty Trust Inc
Top I-88 West Industrial Projects Under Construction
1) Property: Steiner Rd & 143rd St
Rating*: 3
Building SF: 1,500,000
Stories: 1
Completion: Q1 2020
Developer/ Owner: Seefried Properties Inc
1) Property: Butterfield Center (2350 Frieder Ln)
Rating*: 4
Building SF: 503,244
Stories: 1
Completion: Q4 2019
Developer/ Owner: Sterling Bay / Theodore Novak
South I-55 Industrial Construction Projects Statistics
All-Time Annual Average Square Feet: 407,292
Delivered SF (Past 4 Qs): 2,036,727
Delivered SF (Next 4 Qs): 1,810,015
Proposed SF (Next 4 Qs): 3,591,150
Top South I-55 Industrial Projects Delivered
1) Property: Interchange 55 Logistics (901-1001 W Bluff Rd))
Rating*: 5
Building SF: 684,320
Stories: 1
Completion: Q3 2019
Developer/ Owner: CT Realty Investors
2) Property: Airport Logistics Center 1 (20100 Renwick Rd)
Rating*: 5
Building SF: 543,780
Stories: 1
Completion: Q3 2019
Developer/ Owner: Duke Realty Corporation
Top South I-55 Industrial Projects Under Construction
1) Property: 775 Veterans Pkw
Rating*: 5
Building SF: 573,752
Stories: 1
Completion: Q2 2020
Developer/ Owner: Not Listed / Trammell Crow Residential
2) Property: Romeoville Gateway (Route 53 & Joliet Rd)
Rating*: 4
Building SF: 351,870
Stories: 1
Completion: Q1 2020
Developer/ Owner: IDI Logistics / Vynera Transportation Inc
Data Sources: Cawley Commercial Real Estate & CoStar